Ticks and the diseases they carry are spreading so quickly across the United States — likely driven by climate change — that the government is having trouble keeping up with the data.
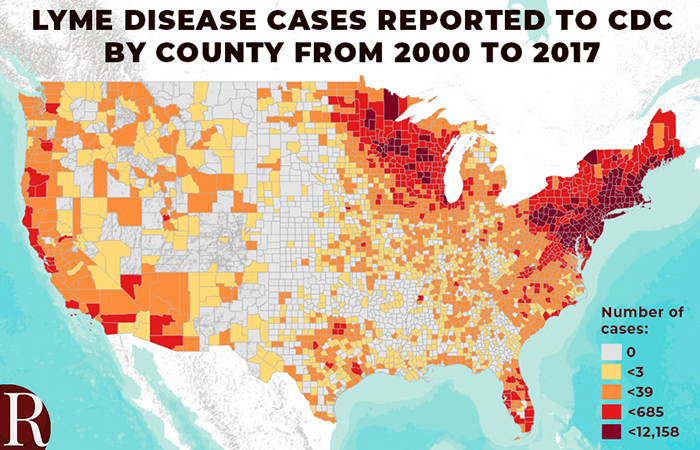
In the past most cases of Lyme disease, the country’s most common tick-borne illness, occurred in the Northeast, mid-Atlantic and Upper Midwest states. But a recent report issued by lab-testing company Quest Diagnostics reveals the disease has dramatically expanded its range. According to the report, Lyme disease has now been found in all 50 states.
“Our data show that positive results for Lyme are both increasing in number and occurring in geographic areas not historically associated with the disease,” Quest’s senior medical director, Harvey W. Kaufman, M.D., said in a prepared statement last summer. “We hypothesize that these significant rates of increase may reinforce other research suggesting changing climate conditions that allow ticks to live longer and in more regions may factor into disease risk.”
Lyme outbreaks have long been tracked by the Centers for Disease Control and Prevention, but the agency’s data present an incomplete picture because Lyme reporting is still voluntary in many states. Quest’s report, compiled from data on physician-ordered blood tests for the disease, presents a bigger picture of the spread and shows higher numbers of cases in some states than those in the CDC’s records. Quest’s Lyme disease cast count for California in 2017 is more than three times higher than the CDC’s count.
Adding to the picture, a recent citizen science study published in PLoS ONE detected the species of tick that carries Lyme disease in several counties previously not reported by the CDC.
The spread of these ticks and their diseases is just one more economic cost created by climate change. A recently published review found that the annual economic impact of Lyme disease in the United States is $786 million — and that’s only going to grow as the disease continues to advance. Groups are now advocating for increased government budgeting for Lyme disease initiatives.
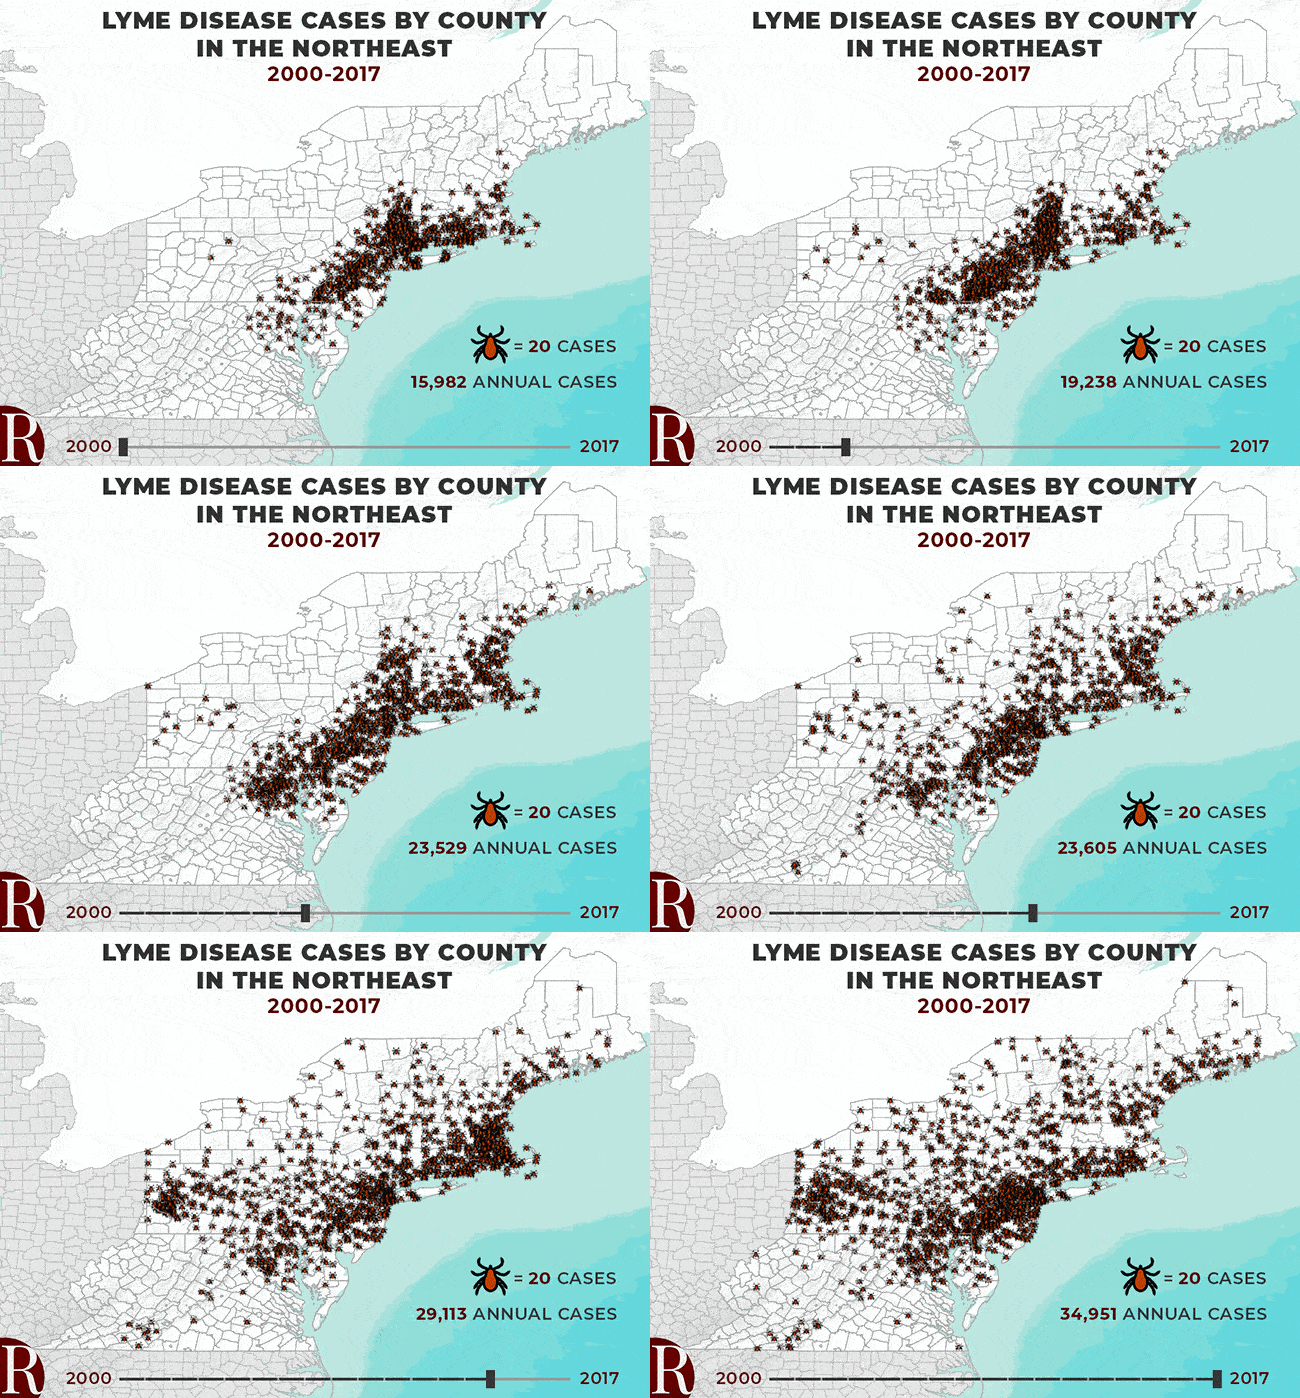
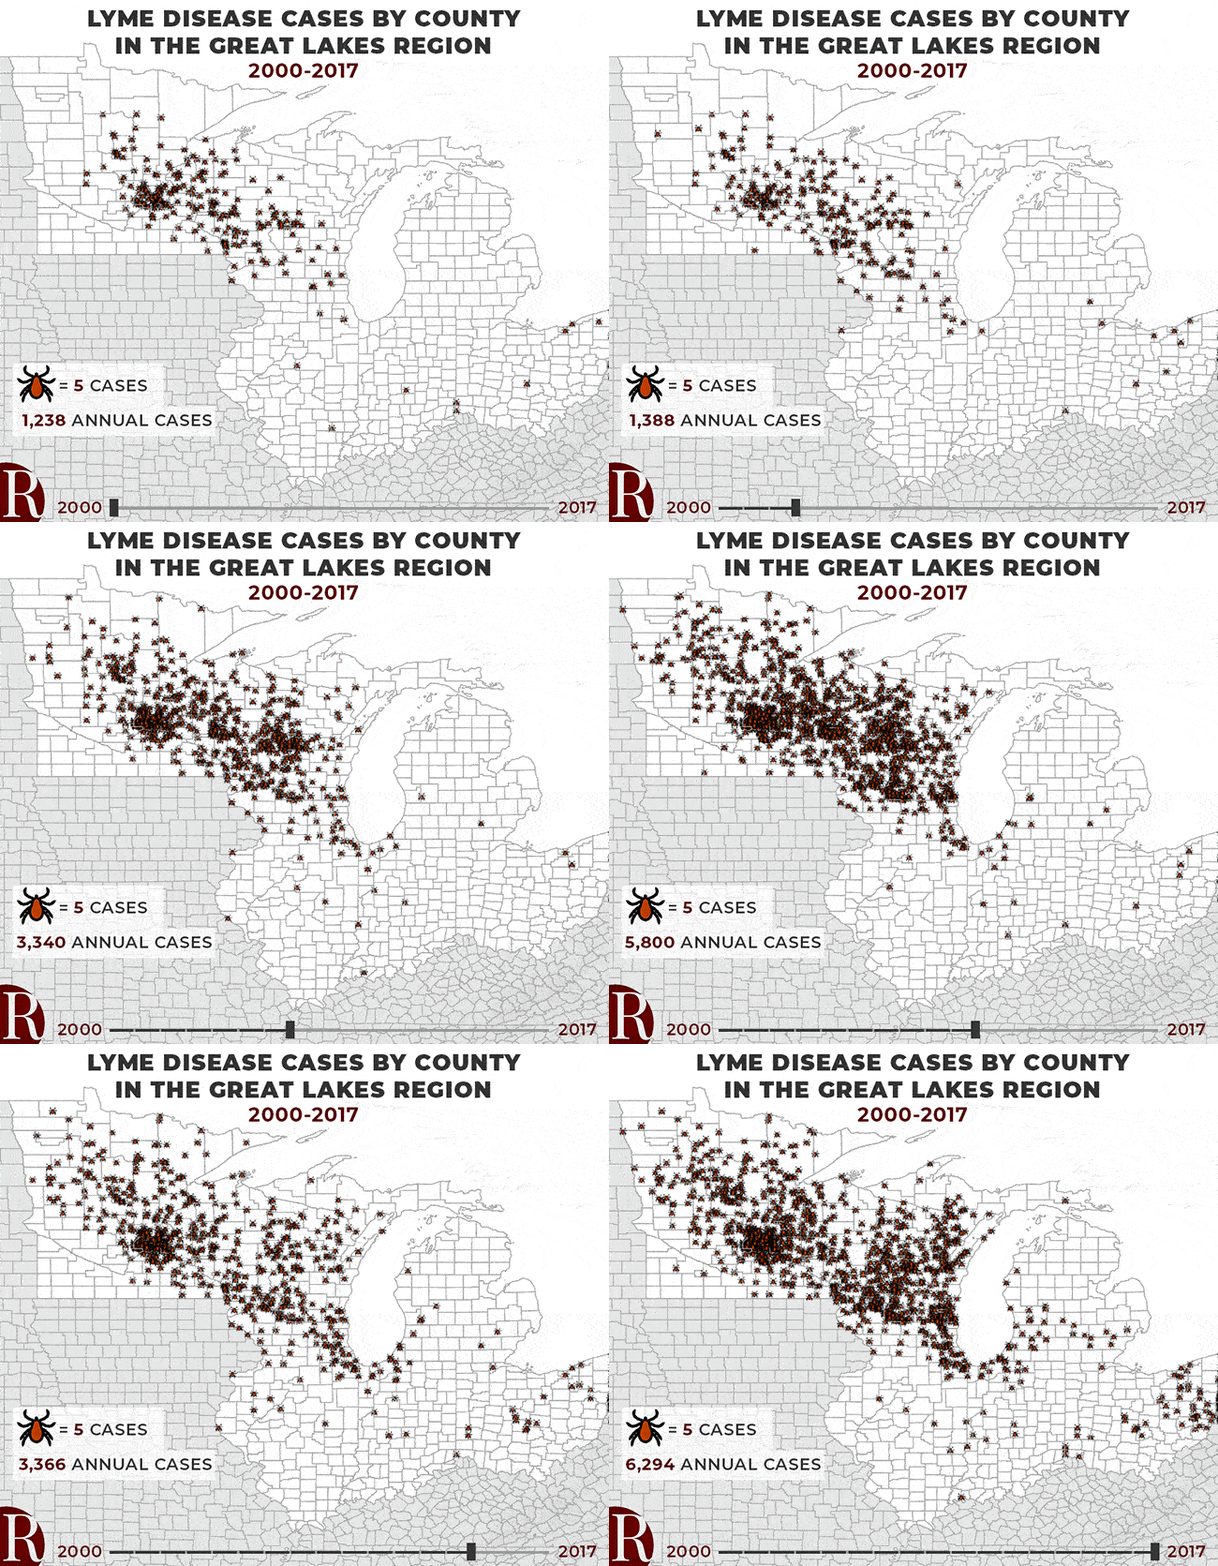
How bad is it? These maps show the geographic spread and steady increase in Lyme disease cases in the states where it is still most prevalent. (According to the CDC, these numbers probably represent about one-tenth of all new U.S. Lyme diseases cases.)

Note: The CDC’s records for Massachusetts have dropped sharply since 2016, though the state reports that new infections have continued to rise through that period.


For more information on Lyme disease and your risks, visit cdc.gov/lyme/.
Sources and Methods:
County-level Lyme disease data reported to the Centers for Disease Control and Prevention from 2000 – 2017 available here.
Dot density maps were developed in ArcGIS Pro by randomly placing a tick symbol within a county’s boundaries for every 20 or 5 Lyme diseases cases (in the Northeast or Great Lakes regions respectively) reported from that county.
The CDC’s surveillance data are captured by county of residence, not county of exposure. The CDC also notes this data set is limited by under-reporting of cases in highly endemic areas.
![]()


1 thought on “March of the Ticks: Is Lyme Disease Spreading Faster Than We Can Respond?”
Comments are closed.