
“Precipitation has always been one of the hardest variables to project under climate change,” attests Dr. Astrid Caldas, a senior climate scientist at the Union of Concerned Scientists, “but there’s one thing scientists agree on: Wet areas will likely get wetter, and dry areas will get drier.”
It’s not just the amount of rainfall that will change, but also when and how it falls. Caldas says areas with decreasing total precipitation may actually face an increase in extreme weather — “meaning when it does rain, it is likely to be a heavier rain event.”
Even areas with relatively small projected changes in precipitation can still experience huge impacts because the changes will combine with shifts in temperature, pollution and other factors. As a result, “the consequences can be vast” for crops and natural vegetation, Caldas says.
The exact effects of these changes will vary depending on where people live, according to Dargan Frierson, an associate professor at the Department of Atmospheric Sciences at the University of Washington. “High latitudes and parts of the tropics are expected to get even wetter,” he says. While there may be some short-term relief for the Mediterranean, southern Africa and southern Australia, he says “the longer-term forecast is for drought to return in an even more severe way.”
These predictions are not just warnings for a distant future. They are also significant to our lives today. Research published this year has linked ongoing climate change to recent hurricanes, droughts and other weather patterns that are already becoming more dangerous across the globe.
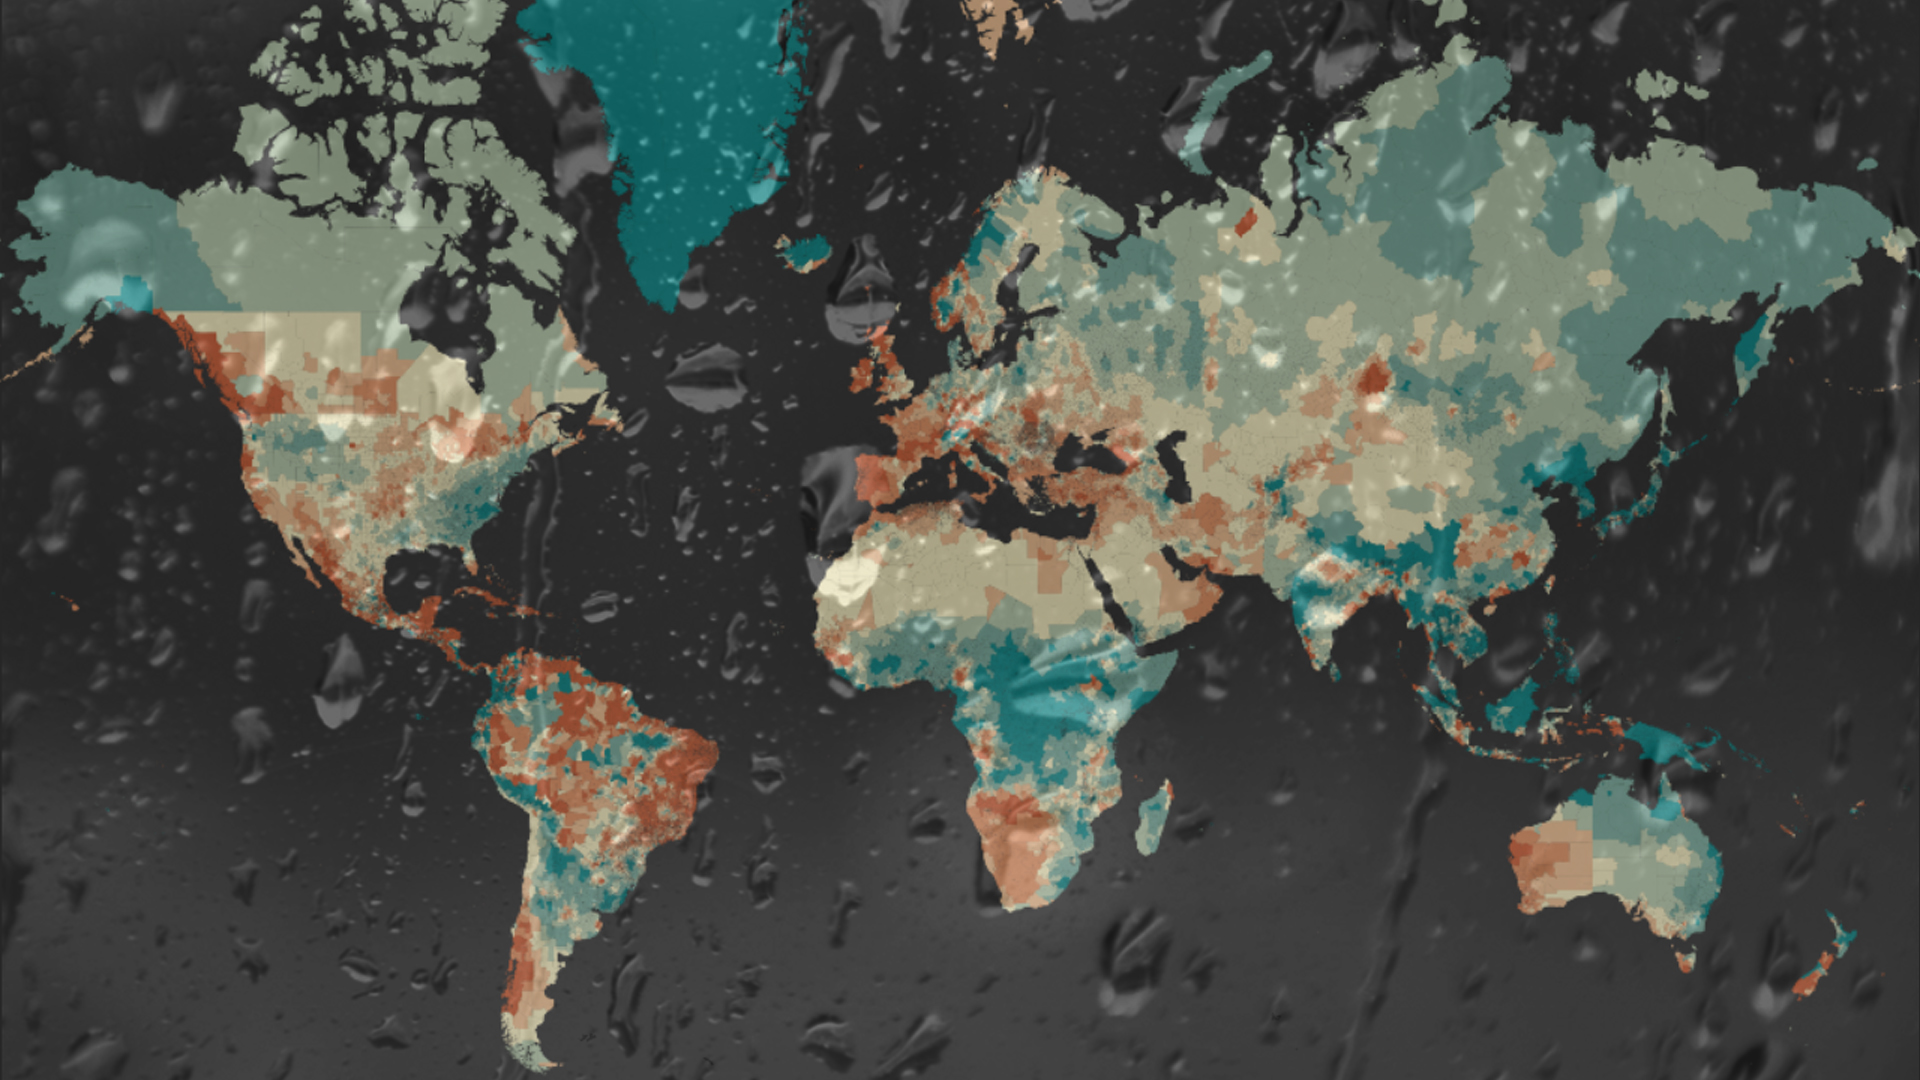
How could you be affected? Explore the map below to see how unmitigated climate change is projected to change average annual precipitation in your area — and around the world — in the 2050s.

Sources and methods:
World Precipitation Change 2050s Scenario: IPCC 5AR CIAT downscaled NCAR CCSM4 model under Scenario 8.5 from CCAFS and partners.
Baseline precipitation for 1970-2000 scenario from WorldClim. (Fick, S.E. and R.J. Hijmans, 2017. Worldclim 2: New 1-km spatial resolution climate surfaces for global land areas. International Journal of Climatology.)
Precipitation change was calculated between historical levels and the 2050s under Scenario 8.5, which represents a high-end emissions scenario if global emissions remain unmitigated. The amount of uncertainty in projections increases at smaller geographic scales. While broad regional trends can be robustly projected, some variation from these averaged projections should be expected at local levels.
Global administrative boundaries data by GADM.
Precipitation change data were averaged by administrative boundaries. Abrupt changes between adjacent areas can be seen in some cases, since natural gradients (caused by elevation changes, for example) present in the raw data are smoothed in this averaging process.
Data analyzed using ArcGIS Pro.

1 thought on “Interactive Map: Precipitation in the 2050s”
Comments are closed.