
The past few summers have brought some of the hottest months on record. Unfortunately, things are only projected to get worse as climate change continues to push temperatures up around the world.
The global impacts of rising temperatures — including more hurricanes, sea-level rise and drought — will probably sound familiar. But a temperature change of just a couple of degrees can also have dramatic effects locally. Studies have shown that a single-degree rise in temperature can increase local levels of air pollution, allow disease-carrying ticks to expand into an area, cause the local extinction of native species and even cause enough heat stress to increase rates of mental illness.
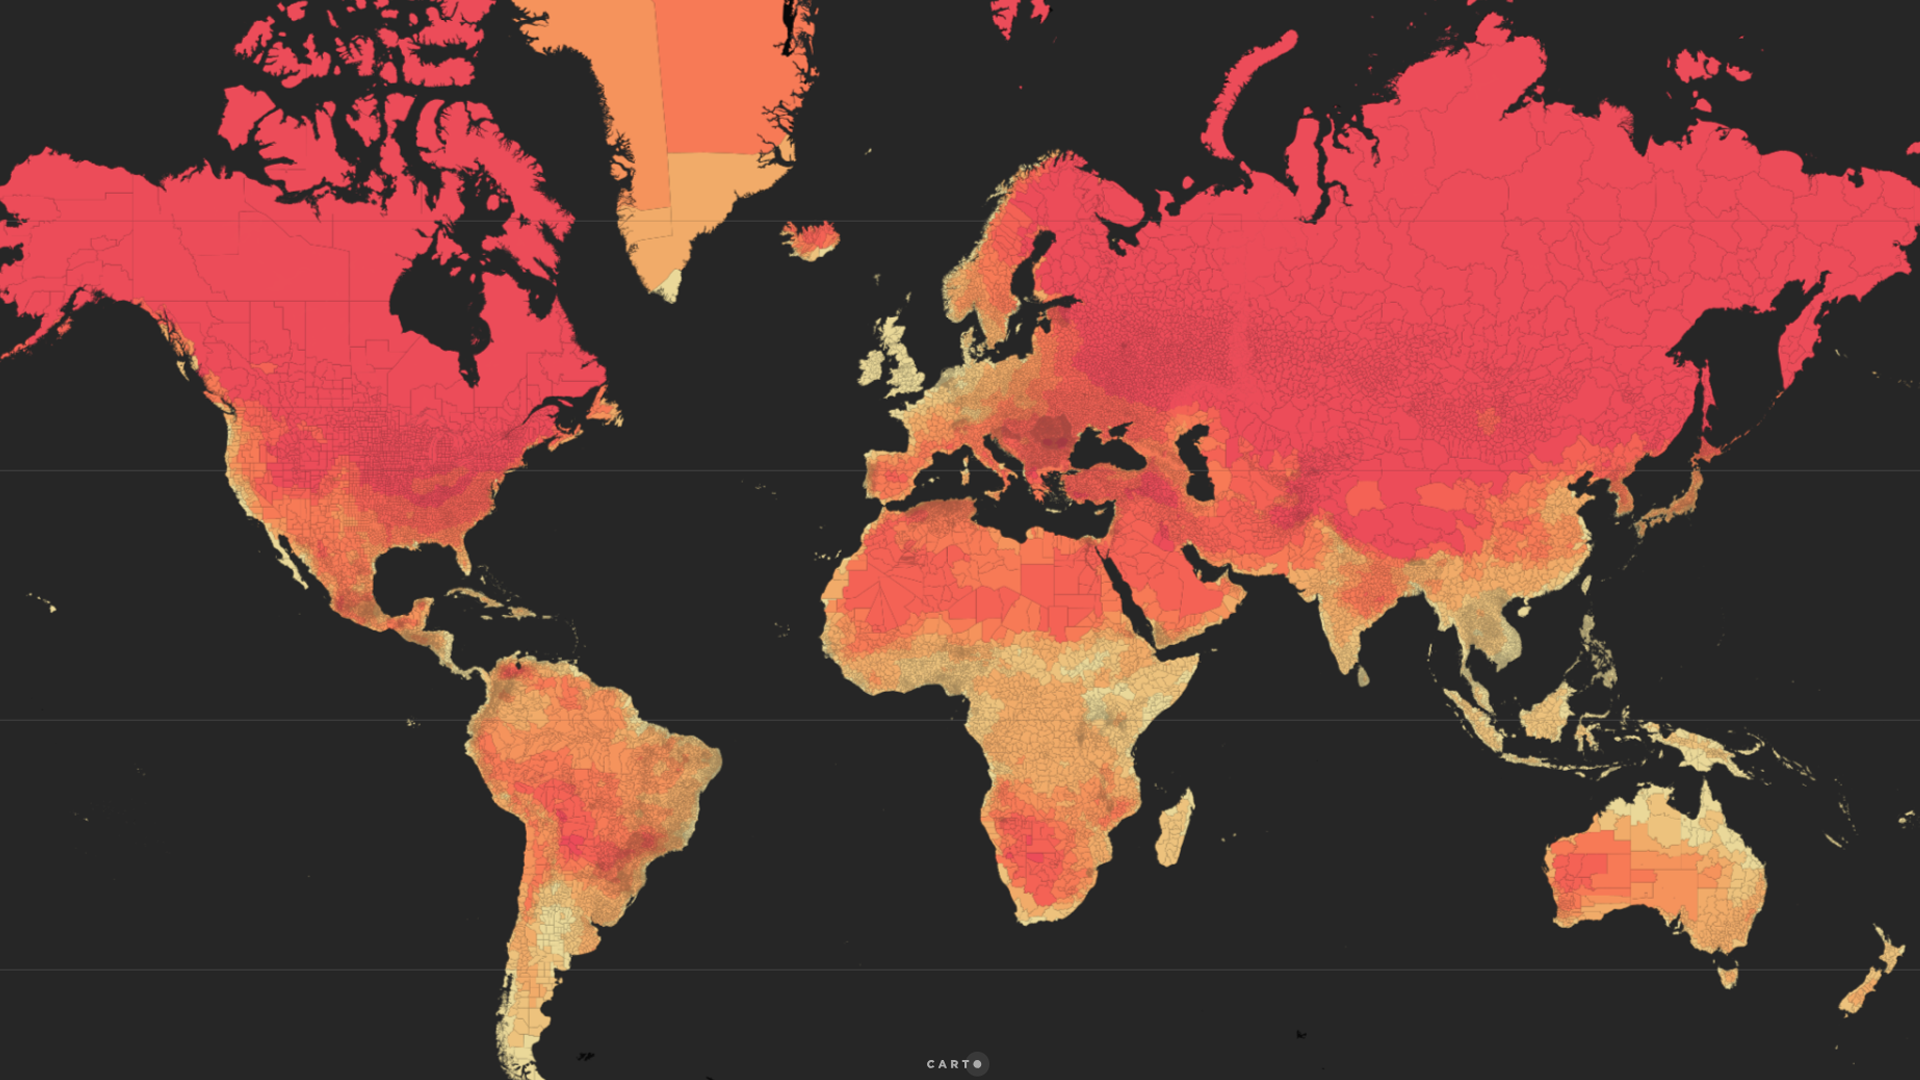
How bad could things become where you live if we continue on our current trajectory? Explore the map below to see how temperatures will change in your area — and around the world — by the year 2050.
Sources and methods:
World Temperature Change 2050 Scenario: CCSM4 model under Scenario 8.5 by ESRI.
Temperature change is calculated between historical levels and the year 2050 under Scenario 8.5, which represents a high-end emissions scenario if global emissions remain unmitigated. The amount of uncertainty in projections increases at smaller geographic scales. While broad regional trends can be robustly projected, some variation from these averaged projections should be expected at local levels.
Global administrative boundaries data by GADM.
Temperature change data were averaged by administrative boundaries. Abrupt changes between adjacent areas can be seen in some cases since natural gradients present in the raw data are smoothed in this averaging process.
Data were analyzed using ArcGIS Pro.

1 thought on “Interactive Map: Climate in 2050”
Comments are closed.