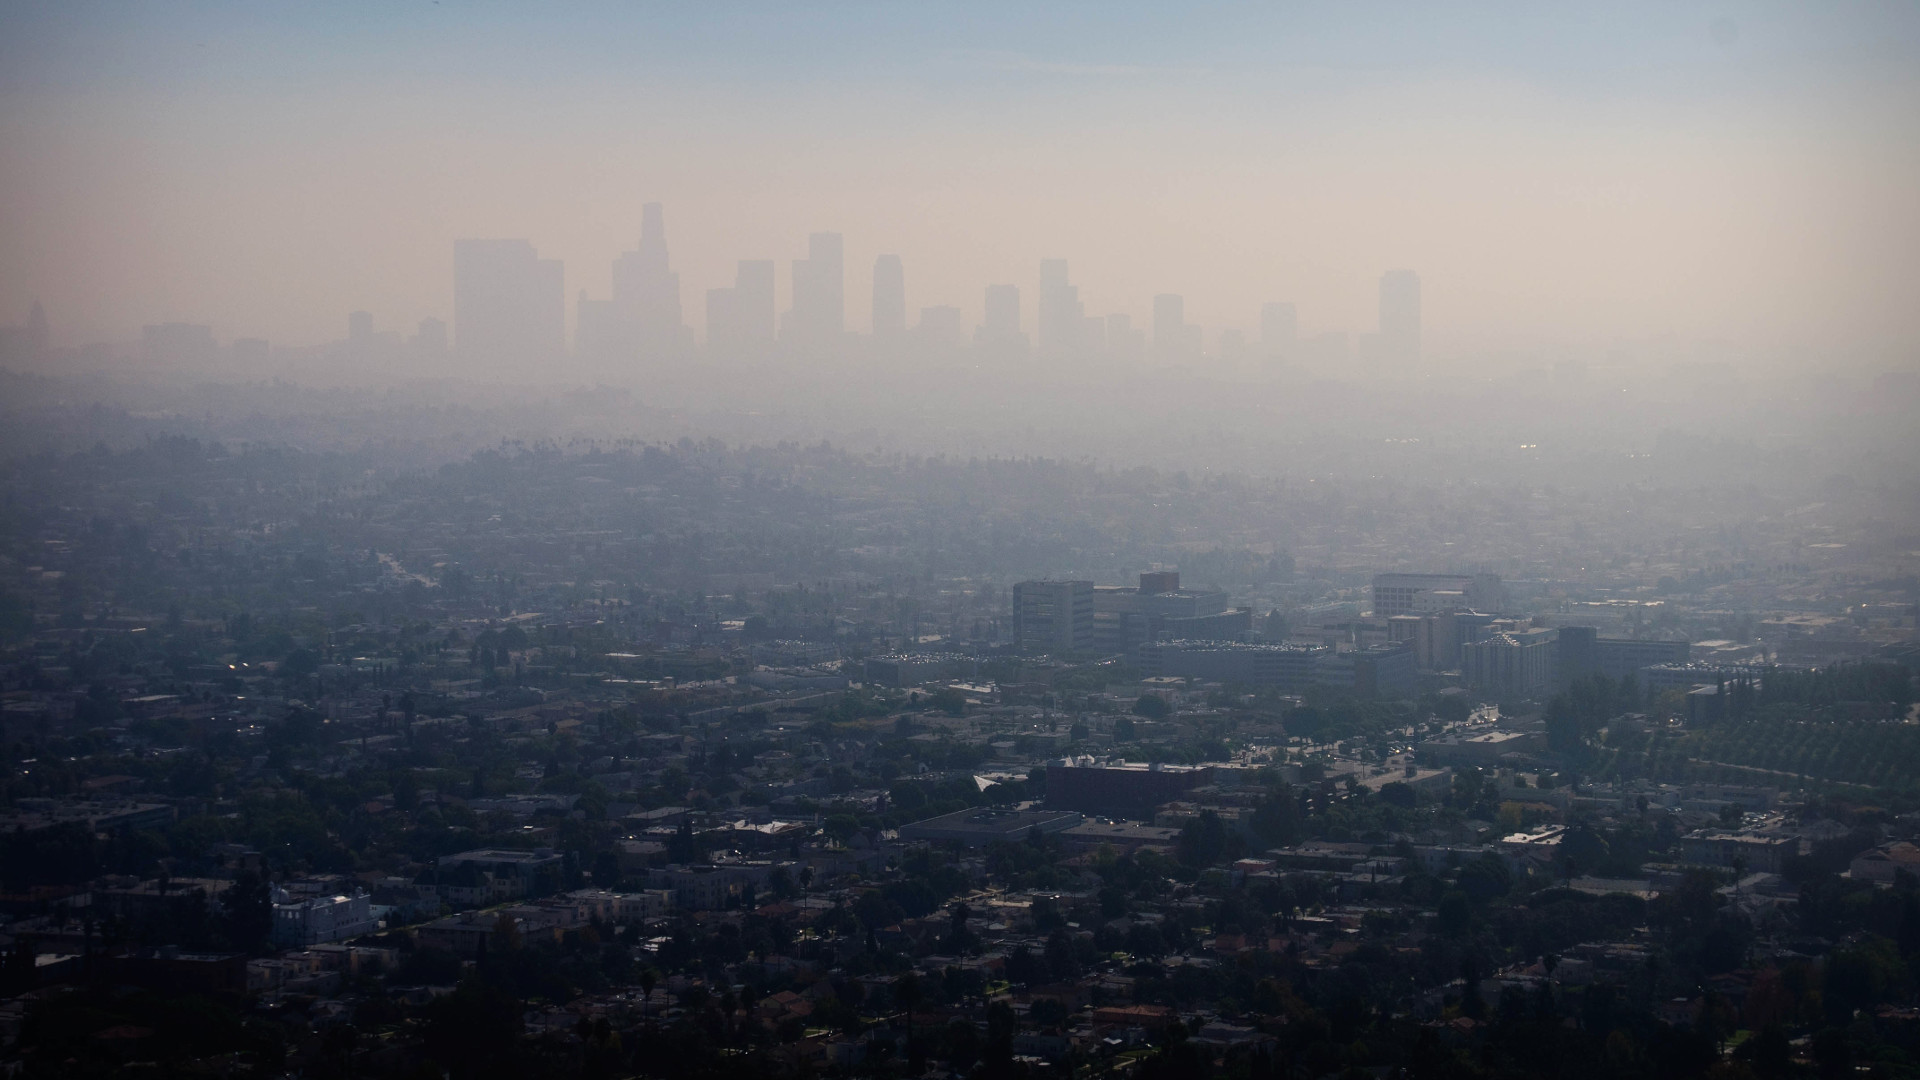
The Environmental Protection Agency’s assessments show that breathing ground-level ozone at levels of just above 0.070 parts per million can cause a range of harmful health effects, including asthma and emphysema.
The effects add up: Air pollution kills tens of thousands of Americans every year and costs the economy over $4 billion.
The damage, however, is not evenly spread. Your exposure to ground-level ozone depends, in no small part, on where you live, and where you live often depends on your economic status. So according to the EPA’s own data — who exactly is America dumping its air pollution burden on?
This map of national ground ozone levels shows a large amount of variation across the country, ranging from safe to hazardous levels. Click on any of the dots signifying monitoring locations to view ozone levels and the demographics of local residents.
The graphic below compares the average American to the average person experiencing different levels of ozone pollution using EPA and census data. Move the slider below the image to explore levels.
The average person experiencing the worst ozone pollution is 11 percent more likely to be a person of color and live in a household with income $7,440 less than the average person being monitored by the EPA overall.
According to this data, the most vulnerable Americans are bearing the brunt of the country’s pollution footprint — of every American’s pollution footprint.
That’s because the ozone and other emissions from a car’s tank of gas don’t just settle where a car travels; drivers are also ultimately responsible for polluting the places fuel was originally extracted, refined and transported — possibly on the other side of the continent.
Too often, that puts the burden of these emissions on racial minorities and low-income families, who disproportionately live near refineries, extraction sites and highways. Research has shown that particulate pollution and ground-level ozone at these types of locations increase the risk of death, even at levels below the government’s air-quality standards. The American Petroleum Institute, however, dismissed a recent report detailing the increased risk to African Americans of cancer and asthma caused by air pollution by natural gas emissions by suggesting their genetics and other social factors were to blame.
The Trump administration is similarly skeptical of the hazards of air pollution and has attempted to delay and missed deadlines in enforcing an Obama administration regulation to curb ozone pollution — one the largest industrial source of which is the oil and gas industry.
In the face of an apparently uncaring industry and government, narrowing this inequity remains an uphill battle.
Data sources and methods
Ozone data:
Highest reported value of available fourth-highest daily maximum 8-hour concentration reported in EPA’s 2016 annual summary data by monitor.
Source
In 2015 the EPA revised the ozone standard to 0.070 ppm using the O3 indicator with 8-hour averaging time and form of annual fourth-highest daily maximum, averaged over 3 years.
Demographic data:
Five demographic criteria were selected from the 2015 American Community Survey Five-year Estimates:
1) Age: median age of total population
2) Income: median household income in the past 12 months in 2015 inflation-adjusted dollars.
3) Educational attainment: percentage of population 25 years and over with an associate’s degree, bachelor’s degree, or graduate or professional degree.
4) Race: percentage of total population reported as black or African American, American Indian and Alaska native, Asian, native Hawaiian or Pacific islander, some other non-white race, or two or more races.
5) Health insurance: percent uninsured of total civilian noninstitutionalized population.
Source
Location averaging:
Zip Code Tabulation Areas (ZCTA) are the geographic unit of study. If more than one air quality monitoring station was present in a single ZCTA, only the station recoding the highest value was retained. Demographic data by ZCTA was then collated by levels of ozone recorded within the ZCTA (0.06 ppm and above, 0.07 ppm and above, 0.08 ppm and above, 0.09 ppm and above). Finally, demographic data were averaged by ozone level category while weighting data by total population of each ZCTA. The ‘average person’ was defined as the average person living in all ZCTAs where all monitoring stations were located.
Data limitations:
The locations of air quality monitoring stations across the country are somewhat arbitrary and do not provide complete national coverage.


